HIPSR Overview
HIPSR is a new reconfigurable digital backend for the Parkes multibeam receiver. HIPSR is capable of running many different firmware modes, so can be used for both high resolution, wide bandwidth spectral line observations, and high time resolution pulsar observations.
As of writing, there are two main modes of operations supported:
- HISPEC 8192 channel, 400 MHz bandwidth spectrometer for HI observations.
- BPSR high time resolution pulsar modes, used in the HTRU survey.
The documentation here focuses on HISPEC; please head over to [??] for documentation on the pulsar modes.
If you’re in a hurry, skip down to HIPSR User’s Guide. Otherwise, continue reading for an introduction to the HIPSR system.
Hardware
For an in-depth overview of the HIPSR hardware, head over to the the Hardware chapter. To give a quick overview, HIPSR consists of:
- 13x dual-input CASPER iADC digitizer cards,
- 13x CASPER ROACH FPGA digital processing boards for “low-level” signal processing
- A Cisco 10GbE switch for data interconnect
- A CPU/GPU cluster for “high-level” DSP and data storage.
These are located in racks R, S, and T. All of the signal processing nodes in HIPSR are connected with Ethernet; the network architecture is shown in the figure below:
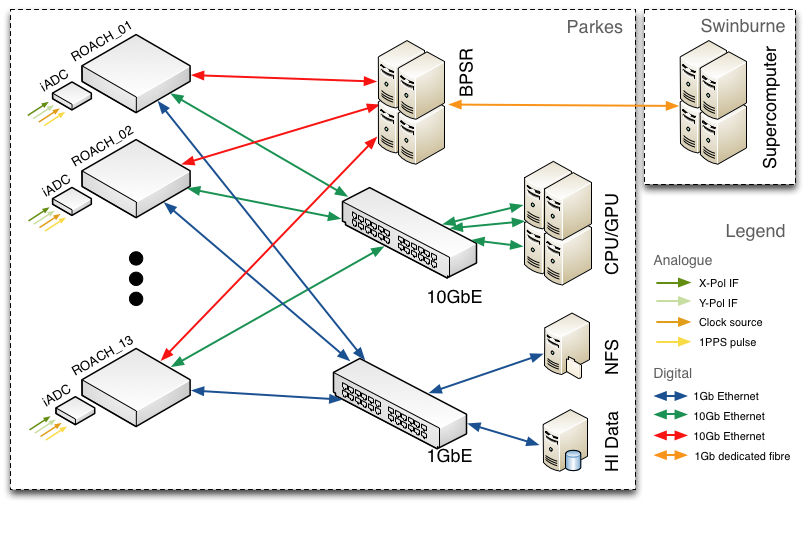
Network architecture for HIPSR.
Note
The GPU servers are mainly used for pulsar work. All of the signal processing for HISPEC (HI spectrometer) is currently done on the CASPER ROACH boards. Future (lower bandwidth) modes of observation will likely use the GPU servers too.
Software
If you really want to know what’s going on, the module listing and API can be found here: Software. A quick run-through is shown below.
hipsr-server.py
For HISPEC, all of the signal processing is done on the ROACH boards. The ROACH boards are controlled by a script, hipsr-server.py, which collects data from the ROACH boards and metadata (e.g. pointing info) from the telescope control system (TCS). The server script then writes the data to HDF5 files. Note that hipsr-server.py does not control telescope pointing, it only collects and collates data/metadata.
hipsr-gui.py
Data from HISPEC can be monitored using the hipsr-gui.py script. This script gives shows the bandpass from all 13 beams, and has a beam scope, waterfall plotter and total power monitor.
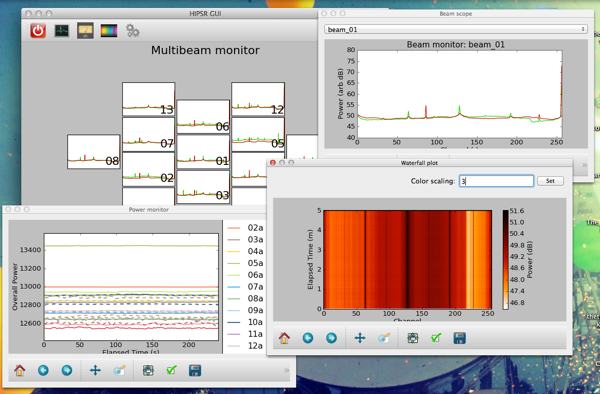
Screenshot of hipsr-gui running on Mac OSX.
hipsr-writer.py
The hipsr-writer.py script converts files from HDF5 to SD-FITS. At the end of your observations, you’ll want to run this as most data reduction packages don’t support HDF5 yet.
Note
All firmware and software for HIPSR is stored on github: https://github.com/telegraphic/hipsr. It is of course, already installed wherever it needs to be.
How everything fits together
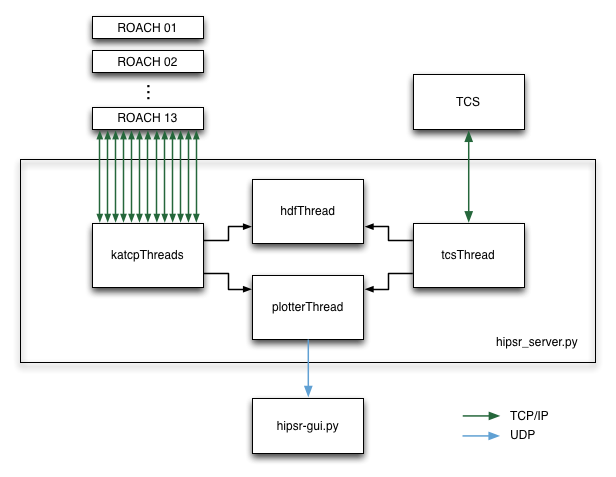
What’s really going on.
The hipsr-server collects, collates and writes data to HDF files. To do this, several threads must be run in parallel. Firstly, a connection to each ROACH board is made using KATCP_, a communication protocol which runs over TCP/IP. Each connection runs in a separate thread. In addition to this, a TCP/IP server is set up to communicate with TCS, which sends ASCII command : value pairs with info about telescope setup, observation config and pointing detiails.
Having multiple threads all attempting to write the same HDF file isn’t good. So, there’s a dedicated HDF thread which has a data input queue, into which the KATCP and TCS threads append data. Finally, so we can see what’s going on, TCS and KATCP threads send a subset of data over a UDP connection to the hipsr-gui.py script, which is generally run on a different computer. This UDP connection sends python dictionaries converted into JSON.